How to profile ACE services
Prerequisites
In Windows run following command to install ab tool:
choco install apache-httpd
Starting service in inspection mode
To profile the service it must be started in inspection mode, which is done by adding node --inspect flag to the start script.
For example sapiens-digital-ace-designer-server/package.json has following inspect script
"inspect": "yarn build && dotenv -c development -- cross-env NODE_ENV=production node --inspect build/index.js",
Then run it
yarn inspect
Profiling the service
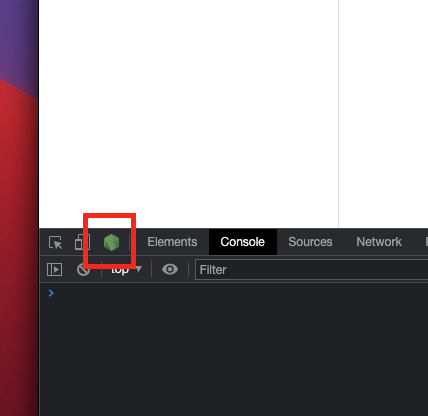
Open profiler
Once service is running in inspection mode, open Chrome and click on Node DevTools icon.
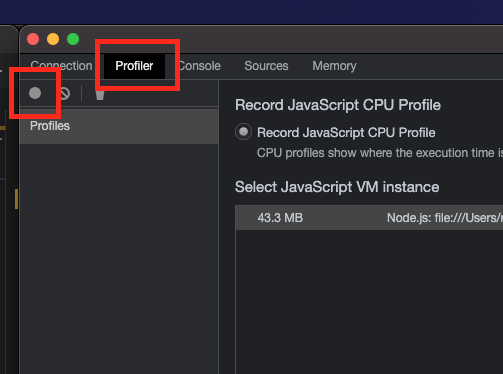
Start profiler
To profile the service open Profiler tab and start the profiler.
Run benchmarking tool
For example import sample flow and api (below) via source editor...
tags: []
sampleInputSchema: ""
sampleData: {}
description: ""
baseFlow: null
steps:
  - name: Step rest-new
    description: ""
    config:
      endpoint:
        url: https://httpbin.org/status/200
        method: GET
      restRequest: JSON
      expectedResponseLocation: body
      targetPath: result
      headers: {}
      oAuthConfig: {}
      mtlsConfig: {}
    stepType: rest-new
    condition: ""
  - name: Step jsonata
    description: ""
    config:
      maps:
        - jsonata: '"OK"'
          targetPath: result
    stepType: jsonata
    condition: ""
path: /status200
method: get
flow: status200.yaml
errorHandlers: []
definition:
  description: ""
  operationId: status200
  tags: []
  summary: ""
  responses: {}
  parameters: []
To run API GET /status200 with 10 concurrent users, in total 100 times (every concurrent user will run it 10 times) run following command:
ab -c 10 -n 100 http://localhost:5050/status200
This should produce meaningful averages for 10 concurrent users
Concurrency Level:      10
Time taken for tests:   10.781 seconds
Complete requests:      100
Failed requests:        0
Total transferred:      20900 bytes
HTML transferred:       200 bytes
Requests per second:    9.28 [#/sec] (mean)
Time per request:       1078.103 [ms] (mean)
Time per request:       107.810 [ms] (mean, across all concurrent requests)
Transfer rate:          1.89 [Kbytes/sec] received
Interesting details here are that it takes 1s (duration) for a single request to execute, but with 10 concurrent users requests executing in parallel it is possible to execute roughly 10 requests per second.
To understand profile a bit better you can run ab with one user.
ab -c 1 -n 1 http://localhost:5050/status200
Stop profiler and analyze the performance
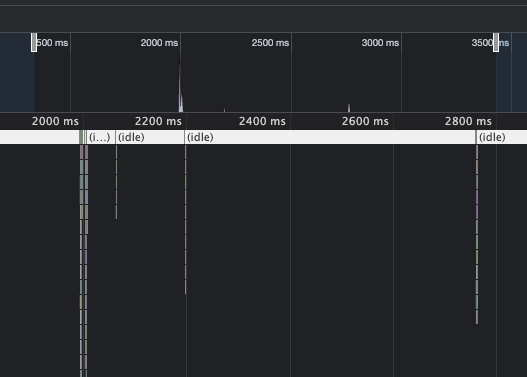
Zoom in timeline:
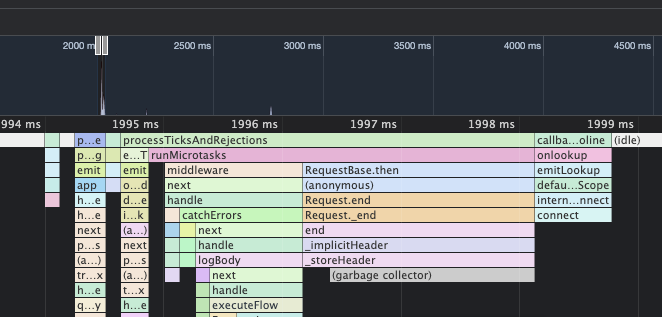
Flow manager processed request in 5ms and proceeded to wait for the response from the remote endpoint...
Performance Logs
To enable Runtime Server performance logs, set LOG_LEVEL to debug.
Relevant information in performance logs is:
transactionId- unique id, to track steps in the flow executionexecution time of each step (ms)total execution time of flow (ms)
Example logs:
{"application":"designer-runtime-server","level":"debug","message":"Step execution time 904(ms)","metadata":{"flow":"status200.yaml","name":"Step rest-new","transactionId":"6b32a4f3-a57a-4f1b-9107-167f3b544374","type":"rest-new"},"module":"FlowExecutor","timestamp":"2024-10-01T11:25:31.225Z"}
{"application":"designer-runtime-server","level":"info","message":"Start step","metadata":{"flow":"status200.yaml","name":"Step jsonata","transactionId":"6b32a4f3-a57a-4f1b-9107-167f3b544374","type":"jsonata"},"module":"FlowExecutor","timestamp":"2024-10-01T11:25:31.225Z"}
{"application":"designer-runtime-server","level":"debug","message":"Step execution time 9(ms)","metadata":{"flow":"status200.yaml","name":"Step jsonata","transactionId":"6b32a4f3-a57a-4f1b-9107-167f3b544374","type":"jsonata"},"module":"FlowExecutor","timestamp":"2024-10-01T11:25:31.235Z"}
{"application":"designer-runtime-server","level":"debug","message":"Flow execution time 914(ms)","metadata":{"flow":"status200.yaml","transactionId":"6b32a4f3-a57a-4f1b-9107-167f3b544374"},"module":"FlowExecutor","timestamp":"2024-10-01T11:25:31.235Z"}
Load tests
To measure end-to-end system performance under stress, it is necessary to create a dynamic API and a simple flow without external dependencies.
This flow will echo back to API that ever is the input.
tags:
  - general
steps:
  - stepType: jsonata
    config:
      maps:
        - mergeArrayItems: {}
          jsonata: $
          targetPath: result
    name: JSONATA Map
    description: ""
    condition: ""
sampleData: {}
path: /echo
method: get
flow: echo.yaml
errorHandlers: []
definition:
  description: ""
  operationId: echo
  tags: []
  summary: ""
  responses: {}
  parameters: []
Benchmark
testme.json
{
 "test":"me"
}
Run load test (100 concurrent users, each doing 10 requests).
ab -T application/json -c 100 -n 1000 -p testme.json http://localhost:5050/echo
With this simple API/Flow, performance should be roughly 15ms per request.
Concurrency Level:      100
Time taken for tests:   12.625 seconds
Complete requests:      1000
Failed requests:        0
Non-2xx responses:      1000
Total transferred:      327000 bytes
Total body sent:        157000
HTML transferred:       103000 bytes
Requests per second:    79.21 [#/sec] (mean)
Time per request:       1262.450 [ms] (mean)
Time per request:       12.625 [ms] (mean, across all concurrent requests)